Power BI
A unified, scalable platform for self-service and enterprise business intelligence
WHY WE USE POWERBI
- Easy to use
- Wide Range of Data Sources
- Real-Time Data Monitoring
- Data Connectivity
- Data Transformation and Modeling
- Meaningful & Interactive Reports and Dashboards
- Natural Language Queries
- Mobile Accessibilities
- Visuals, Filters, Slicer, and Drill-Down/Drill-Up
- Export to pdf
- Share reports and dashboards with others
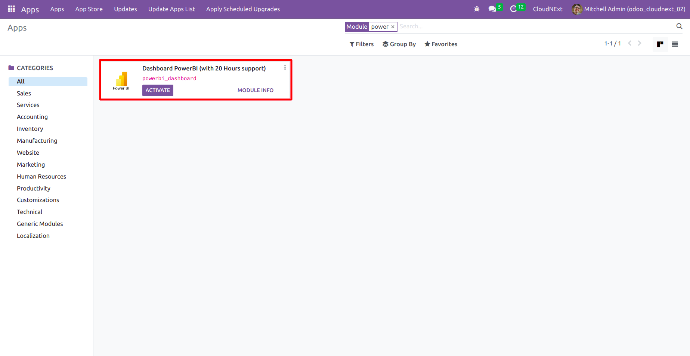
Walkthrough of Application
App in Menu
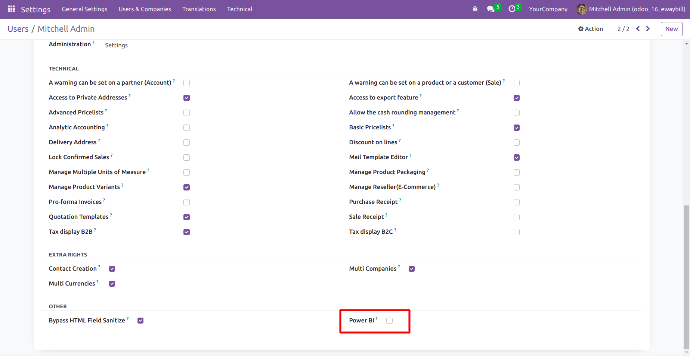
Assign a group to the user.
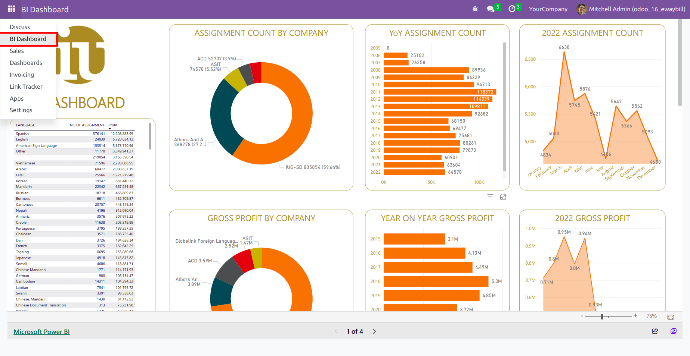
Menu of PowerBI Dashboard.
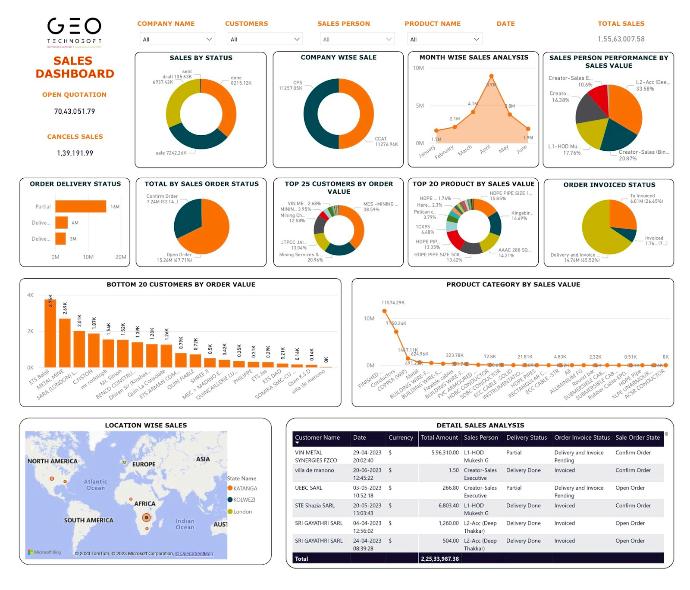
Sales Dashboard
- Company-Wise Sales
- Total Sales & Cancel Sales
- Currency-Wise Sales
- Year-Wise/Month-Wise/Date-Wise Sales
- Salesperson Performance by Sales Value.
- Order Delivery Status
- Order Invoiced Status
- Top Customers by Order Value and Quantity
- Bottom Customers by Order Value and Quantity
- Top Products by Sales Value
- Location-Wise Sales
- Detail Sales Analysis in Table
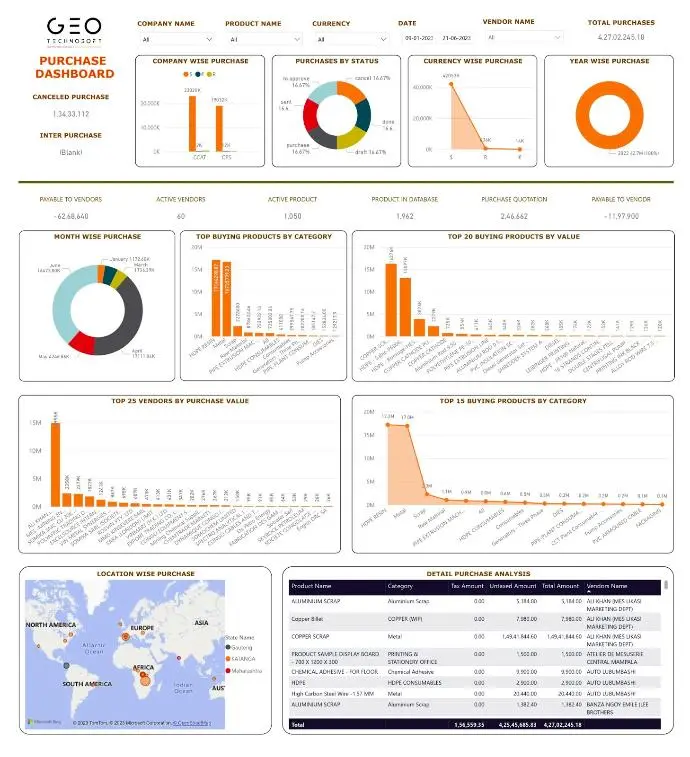
Purchase Dashboard
- Company-Wise Purchase
- Total Purchases & Cancel Purchases
- Currency-Wise Purchases
- Year-Wise/Month-Wise/Date-Wise
- Top Buying Products by Category
- Top Buying Products by Value
- Top Vendors by Purchase Value
- Bottom Vendors by Purchase Value
- Location-Wise Purchases
- Detail Purchase Analysis in Table
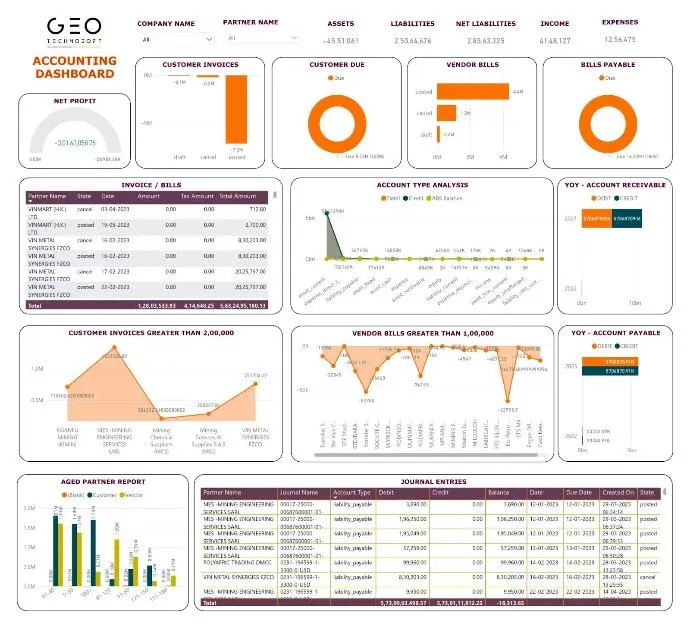
Accounting Dashboard
- Customer Invoices
- Customer Due
- Vendor Bills
- Bills Payable
- Account Type Analysis
- Year-Wise/Month-Wise/Date-Wise Account Receivable
- Year-Wise/Month-Wise/Date-Wise Account Payable
- Customer Invoices (Greater than 2,00,000)
- Vendor Bills (Greater than 1,00,0000)
- Aged Partner Reports
- Journal Entries in Table
Production
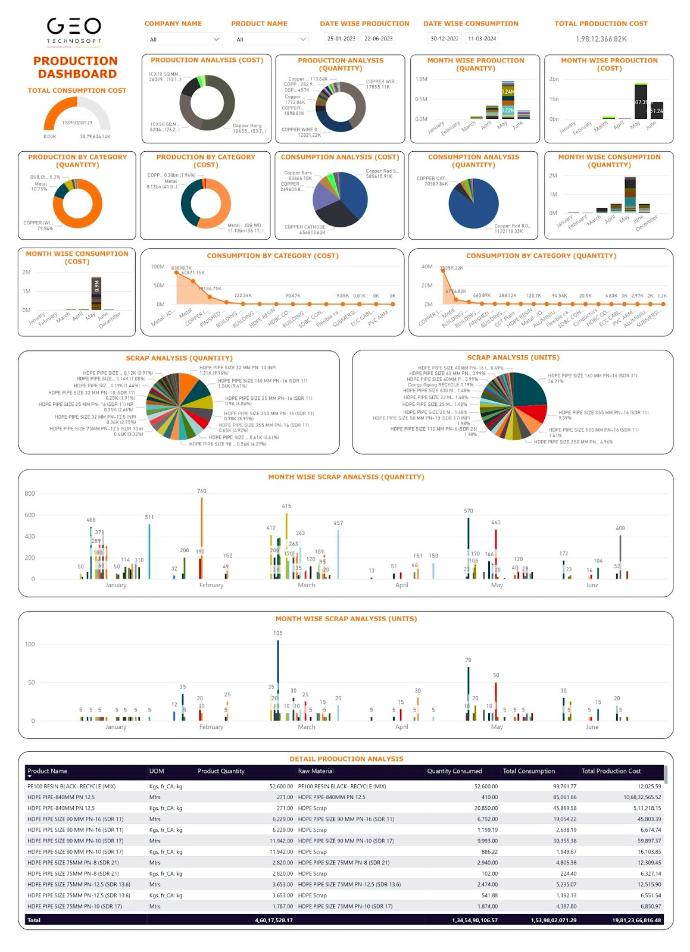
Production Dashboard
- Total Production Cost
- Production Analysis by Quantity & Cost
- Month-Wise Production by Quantity & Cost
- Production by Category (Quantity & Cost)
- Consumption Analysis by Quantity & Cost
- Month-Wise Consumption by Quantity & Cost
- Consumption by Category (Quantity & Cost)
- Scrap Analysis by Quantity & Units
- Month-Wise Scrap by Quantity & Cost
- Detail Production Analysis in Table
- Journal Entries in Table
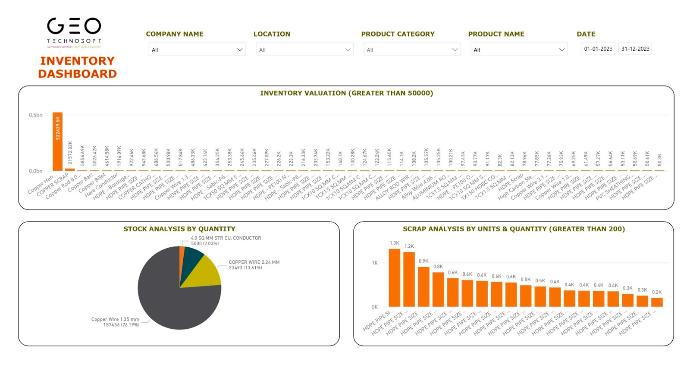
Inventory Dashboard
- Stock Analysis by Quantity
- Inventory Valuation
- Scrap Analysis by Units & Quantity